Lab 6: Fluid Dynamics
Team size: 4
Prelab Help Sheet: None for this lab, but you’ve got this! Review previous ones for ideas.
Writing Assignment: html
1 Introduction
In this lab you will take measurements of objects in a wind tunnel, then simulate the wind tunnel experiments using computational fluid dynamics (CFD) software. This exercise will help you learn about fluid dynamics concepts, provide some possibilities for fluids-related final projects, and help you think about the how simulation, analysis and measurement work together. Simulation, hand analysis and measurement are tools that engineers can use to show that they are correct, and seeking agreement between the three (and knowing when to distrust one or the other) is an essential skill in every engineering discipline.
After successful completion of this lab, you will be able to:
This lab will take place in the Engineering Computing Facility (ECF) in Parsons B178 and the wind tunnel room. E80 students should already have card access to Parsons B178. If you cannot access the room, please contact the Engineering Department Office.
You will be using COMSOL Multiphysics software in this lab. COMSOL is complicated software, and you will struggle to finish the lab if you do not read about its use and practiced with it during prelab. Here are the prelab rules for COMSOL:
- You may practice using COMSOL and go through Granny Spark’s COMSOL tutorials as part of prelab.
- You may not run COMSOL simulations on lab-related objects outside of your designated lab time. These objects include the cylindrical objects tested in the wind tunnel, the “flat plate wing” and the NACA 6412 wing.
- You may not use COMSOL during any other section’s lab time slot because that can deprive students in lab of COMSOL licenses.
Each team will have exactly 60 minutes to use the wind tunnel to run experiments and collect data. The order that teams are sent to the wind tunnel is random and determined at the start of the section, so be ready to go first!
This is a rotation lab, so not all teams will be working on this lab in the same week. Odd numbered teams (11, 23, 35, etc.) will work on Lab 5 in the first week and Lab 6 in the second week; Even numbered teams (12, 24, 36, etc.) will work on Lab 6 in the first week and Lab 5 in the second week. Odd numbered teams will do this lab in week 7, while Even numbered teams work on lab 5. Be sure to watch the correct videos, do the correct quiz, and put in prelab effort for the correct lab!
Safety Tips for the Wind Tunnel
- Follow the dress code for E80 Lab.
- Everyone must wear safety goggles during the test. Hearing protection will be provided if needed.
- Only turn the fan on after checking that there are no loose objects in the test chamber and the test chamber cover plate is secure.
- Ensure that all test personnel are at a safe distance from the wind tunnel itself (at least 24” in any direction).
- Make sure the article under test is securely fastened inside the test chamber.
- Never run the wind tunnel without a proctor or professor present.
- NASA Beginner’s Guide to Aerodynamics (click here)
- E80 fluid measurements lecture notes (click here)
- Airfoil database (click here)
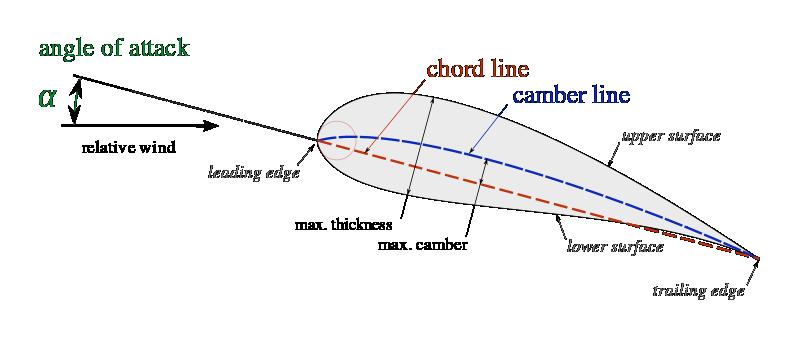
- Airfoil and angle of attack definitions (click here)
- NASA Wing geometry definitions (click here)
- NASA Reynolds Number guide (click here)
- Grandma Spark’s step-by-step video guides to using COMSOL to model 1) a cylinder and 2) a NACA 0009 airfoil in laminar flow (large PowerPoint files, click here). Each slide on the PowerPoints contains a video! Make sure that you press play on each video!
- COMSOL video tutorials for beginners (click here)
- How to use COMSOL 3D geometry tools (click here)
- How to form unions in COMSOL (click here)
- Computing lift and drag forces in COMSOL (click here)
2 Wind Tunnel Experiments
In this section you get a chance to operate Harvey Mudd’s wind tunnel! Pay attention to the wind tunnel safety tips in the introduction. Your team will have exactly 60 minutes to complete this section.
2.1 Getting to Know Your Wind Tunnel
In this sub-section, you will familiarize yourself with the wind tunnel. Do the following after a professor or proctor shows you the wind tunnel room.
- Locate the important pieces of wind tunnel control and measurement technology items shown in Figure 1.
- Ensure that the LVDT box is turned on. If it is not, the switch is on the right side of the box in the rear. DO NOT TOUCH THE KNOBS ON THE FRONT OF THIS BOX.
- Safely open the test chamber: Ensure that the fan is not running in the wind tunnel by pushing the “STOP” button on the RPM controller, then Open the wind tunnel test chamber by removing the four clamps and gently removing the window.
- Verify that there is nothing but a Pitot tube (which looks like this) and the force measurement stand in the wind tunnel. If there are other objects in the wind tunnel, remove them.
- Observe the mounting of the Pitot tube in the wind tunnel. Ensure that the end of the tube is properly oriented directly facing the incoming airflow. Ensure that the pitot probe is connected to the digital manometer.
- Turn on the digital manometer. Zero it.
- Test the LVDT by doing the following while observing lift and drag force readouts:
- GENTLY push on the left side of the force measurement stand with one finger.
- GENTLY push on the right side of the force measurement stand with one finger.
- GENTLY push on the top of the force measurement stand with one finger.
- GENTLY pull on the top side of the force measurement stand with two fingers.


2.2 Wind-Speed to Fan Speed Calibration Curve
In this subsection you will create a calibration curve that relates airspeed in the wind tunnel to fan RPM.
- Perform safety checks for wind tunnel startup:
- is the window on the test section clamped securely at four corners?
- is everyone wearing safety goggles?
- is the test chamber free of loose debris?
- Power up the wind tunnel by pushing the green button labeled “START” on the gray box.
- Adjust the fan speed with the knob on the RPM Controller while reading the RPM from the Fan Speed Display. Adjust the fan speed from 15% to 85% of max fan speed (in increments of 10%). At each fan speed, measure the airspeed.
- Zero the speed in the wind tunnel and push the red button labeled “STOP” on the gray box.
To increase the accuracy of your wind speed measurements, allow time at each measurement for the wind tunnel to come to steady state. Also, repeat measurements with increasing and decreasing RPM to ensure reproducible results.
To calculate air velocity, you can use
- this Excel spreadsheet PitotVelocityCalculator
- this Google Sheet,
- the Dwyer Air Velocity Calculator
- the Dwyer Air Velocity Calculation Card that has been placed next to the wind tunnel.
Using these tools or the card requires that you know:
- The ambient (room) temperature. Read the temperature sensor in the room.
- The relative humidity. Read the humidity sensor in the room.
- The absolute air pressure. Use a barometric pressure app on a cell phone.
2.3 Measuring the Drag Forces on Cylindrical Objects
- Safely open the test chamber using the same steps as instruction 3 in Section 2.1.
- Mount the cylindrical fixture on the force measurement stand and ensure that it is horizontal. Make sure that the side of the cylinder that says “FRONT TOWARDS FLOW” is facing the incoming flow.
- For each of “Nose #1”, “Nose #2” and “Nose #3”
- Install the nose on the cylinder. PLEASE BE GENTLE! You can break the force measurement stand. Ask for help if you think you are pushing hard.
- Safely power up the wind tunnel by performing the same checks as instruction 1 in Section 2.2.
- Record values for lift and drag shown on the LVDT box at zero flow velocity. These are instrument offsets that must be subtracted from your future measurements.
- Measure the drag force on the object from 15% to 55% of max fan speed (in increments of 5%).
- Bring the flow back down to zero and press the red “STOP” button.
2.4 Measuring the Drag Forces on a Scale Robot Model
- Safely open the test chamber using the same steps as instruction 3 in Section 2.1.
- Mount the 1/3 scale model of the robot in the wind tunnel chamber using a zip tie as shown in Figure 2. Pay attention to its orientation.
- Safely power up the wind tunnel by performing the same checks as instruction 1 in Section 2.2.
- Record necessary calibration information, then record drag force on the object from 15%-55% of max fan speed (in increments of 5%).


2.5 Plot Results
- Return to Parsons B178
- Plot a calibration curve of airspeed in the test section versus RPM. Perform the necessary regression analysis and display the appropriate error bars.
- For each nose and the scale robot model:
- Plot a curve of drag force vs. Reynolds number
- Plot a curve of drag coefficient vs. Reynolds number using appropriate characteristic lengths and reference areas.
3 CFD Simulations of Cylindrical Objects and Robot Model
In this section we will perform fluid dynamics simulations of the same objects that are tested in the wind tunnel. This will offer us a chance to compare simulation and reality. We will also use similitude to compare our wind tunnel results against a simulation of a full-sized robot traveling in water.
Make sure to download and watch Grandma Spark’s step-by-step video guide to using COMSOL to model a cylinder in laminar flow (106 MB PowerPoint File, click here). Each slide on the PowerPoint contains a video. Make sure that you press play on each video. The guide has specific instructions for creating some of the trickier plots below: the velocity profile and the filled pressure contour plot.
First, carry out simulations for each of the nose cones used in the wind tunnel.
- Build the nose cone in COMSOL so that its dimensions match Figure 3. Note that the wind tunnel test section is 1 ft x 1 ft x 2 ft.
- Perform COMSOL CFD simulations that replicate your tests in the wind tunnel.
- Use your simulated results to plot drag force vs. Reynolds number for air velocities between 5 m/s and 45 m/s (in increments of 10 m/s).
- Use your simulated results to plot coefficient of drag vs. Reynolds Number for air velocities between 5 m/s and 45 m/s (in increments of 10 m/s).
- Create a velocity profile (single slice at centerline of body) for the 45 m/s flow condition. Grandma Sparks step-by-step guide shows you how to do this.
- Create a pressure contour plot (Contour Type: Filled) for the 45 m/s flow condition. Grandma Sparks step-by-step guide shows you how to do this.
- Comment on how your computational results for drag and coefficient of drag compare to your experimental results. Come up with factors that could cause differences between the results.


Second, simulate a full-scale model of your robot (found here) in water at various velocities such that the Reynolds number is comparable to the Reynolds number of the small-scale model of the robot in the wind tunnel.
- Unlike the nose cones, you will import an already existing model of the robot:
- Select Model Wizard -> 3D -> Laminar Flow -> Stationary. Set units under the Geometry tab in the left hand column.
- Right click on “Geometry” in the left hand column and select “Import”. When importing, make sure that under “Objects to import” both the “Solids” and “Surfaces” boxes are checked and that under “For surface objects:” you select “Form solids” (see Figure 4 for a screenshot showing this setup).
- Create the box and set up the laminar flow simulation as usual.
- Plot the drag force vs. Reynolds Number for your simulated robot
- Plot the coefficient of drag vs. Reynolds Number for your simulated robot
- Comment on how your computational results for drag and coefficient of drag compare to your experimental results. Come up with factors that could cause differences between the results. Explain how similitude helps you to simulate at these very different scales.

4 CFD Simulations of Wings
In this section you will use CFD to simulate wings so that you can explore the effect of wing shape and angle of attack on lift and drag.
For parts 2 and 3 of this section, please make sure to watch Grandma Spark’s step-by-step video guide to using COMSOL to model a NACA 0009 airfoil in laminar flow (164 MB PowerPoint File, click here). Each slide on the PowerPoint contains a video. Make sure that you press play on each video.
- Construct two wings in COMSOL.
- a “Flat Plate Wing” that COULD be tested in the wind tunnel using the dimensions in Figure 5. Note that the wind tunnel test section is 1 ft x 1 ft x 2 ft.
- a wing based on the NACA 6412 airfoil that has a similar reference area as the “Flat Plate Wing”
- Identify the appropriate reference area and characteristic length to determine the lift force and coefficient of lift for the flat plate.
- Perform COMSOL CFD simulations of both wings (the “Flat Plate Wing” and the wing based on the NACA 6412 airfoil). Do so at three angles of attack (5°, 15°, and 45°) as the flow is varied between 5 m/s and 45 m/s. Then, for each wing, plot the following based on your simulated results:
- Plot the lift force vs. Reynolds Number. Plot a curve for each angle of attack on the same axes so that you can compare your results. Make sure to include a legend.
- Plot the coefficient of lift vs. Reynolds Number. Plot a curve for each angle of attack on the same axes so that you can compare your results. Make sure to include a legend.
- Create a pressure contour plot (Contour Type: Filled) for the 45 m/s flow condition at a 15 degree angle of attack.
- Plot the lift force vs. Reynolds Number. Plot a curve for each angle of attack on the same axes so that you can compare your results. Make sure to include a legend.
- Compare the performance of the wings.
- How does the pressure on the bottom of the flat plate wing compare to the top of the flat plate wing at a 15 degree angle of attack?
- How does the NACA 6412 wing’s Coefficient of Lift compare to the flat plate at an angle of attack of 15 degrees?
- How do the pressure differences between the top and bottom surfaces of the NACA 6412 wing compare to the pressure difference on the flat plate at 45 m/s and a 15 degree angle of attack?

